Business performance and market context
Data Analytics for Marketing, Revenue, and Business Decisions
Data analytics services connect website, advertising, ecommerce, CRM, sales, and customer data with the market conditions that shape performance. The work is built for business leaders who need to separate tracking errors from real changes in demand and decide what deserves action.
- Cross-channel performance evidence
- Seasonality and consumer context
- AI-assisted analysis with human review
On this page
Add a header to begin generating the table of contents
Business Analytics Connects Performance Data to Market Conditions
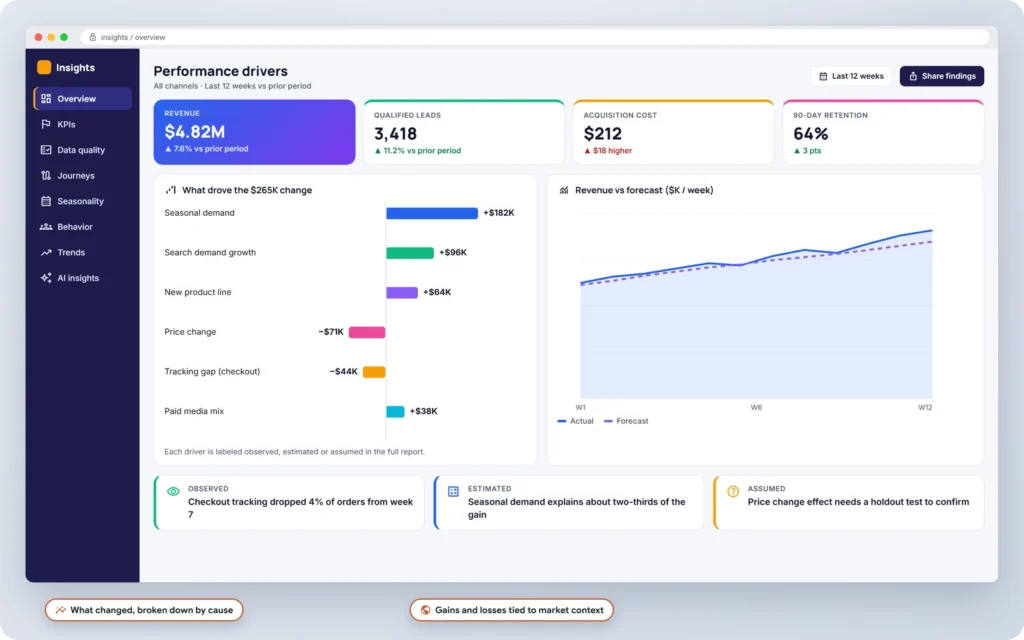
Reporting shows what moved. Analysis explains where the movement started and which evidence supports the explanation.
Internal records can show changes in traffic, conversions, transactions, campaign activity, sales, and customer behavior. But those systems rarely capture the full cause. Seasonality, competitor activity, pricing, economic conditions, and shifts in demand can change performance without appearing inside a tracking platform.
The job is to reconcile both sides. Reliable analysis separates measurement problems from actual business changes, then identifies the decisions the evidence can support.
What's included
What Business Performance Analysis Includes
A useful review starts with data quality, then connects channel activity with customer behavior and market conditions. Each area answers a different part of the same question: what changed, why it changed, and what the business should examine next.
01
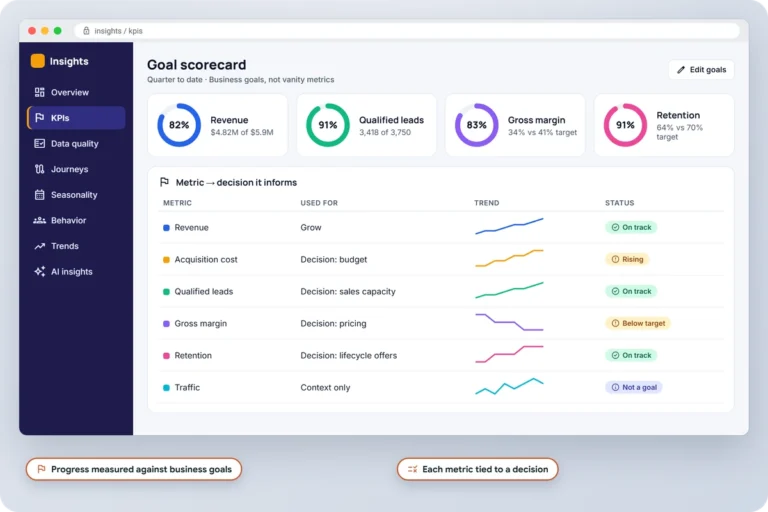
KPI Analysis Ties Metrics to Business Decisions
A metric matters only when it informs a decision. Revenue, qualified leads, acquisition cost, retention, margin, and operational capacity show more about business performance than traffic or conversion volume alone.
02
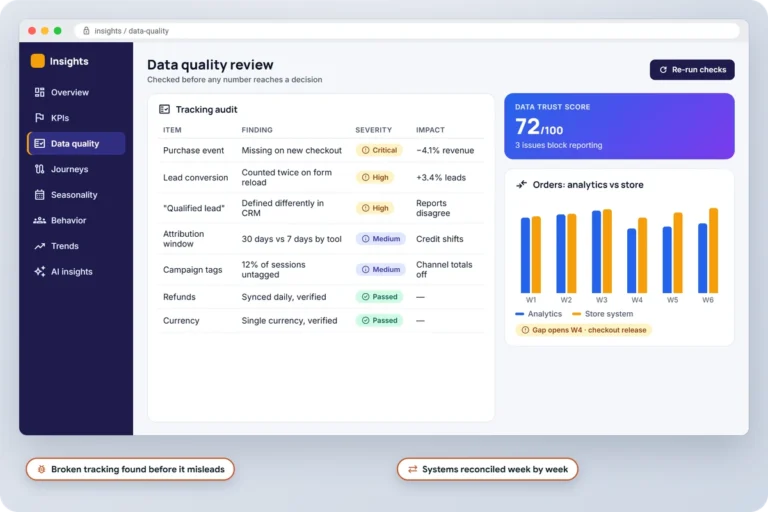
Data Quality Audits Find Broken or Conflicting Records
Missing events, duplicate conversions, inconsistent definitions, and disconnected systems can produce convincing but incorrect reports. A data-quality audit checks which records agree before those numbers influence a decision.
03
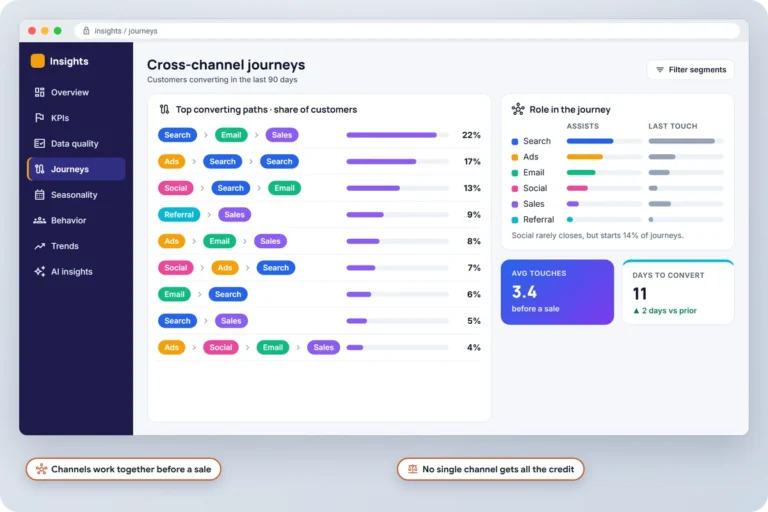
Cross-Channel Analysis Shows How Customers Convert
Customers can move through search, advertising, email, social media, referrals, sales teams, and offline channels before converting. Cross-channel analysis shows how those interactions work together without giving the full outcome to one recorded touchpoint.
04
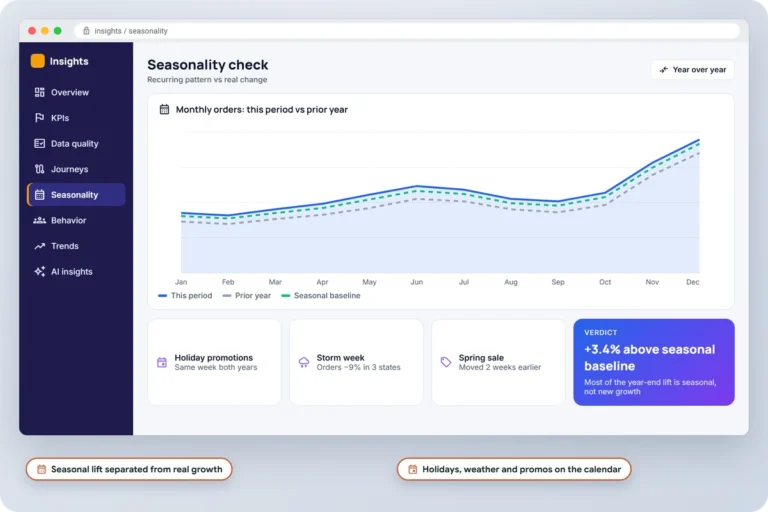
Seasonality Analysis Separates Recurring Demand From Real Change
Year-over-year comparisons, holidays, promotions, weather, and category demand show whether a movement is seasonal or unusual. That prevents routine cycles from being reported as growth, decline, or a campaign failure.
05
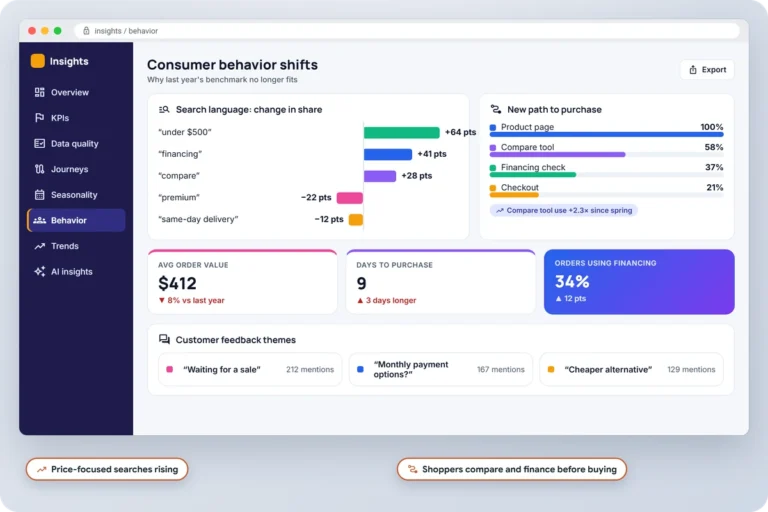
Consumer Behavior Analysis Explains Why Demand Shifts
Search language, product interest, purchasing priorities, conversion paths, and customer feedback change as buyers respond to prices, technology, and competing options. Those shifts can make an older benchmark less useful.
06
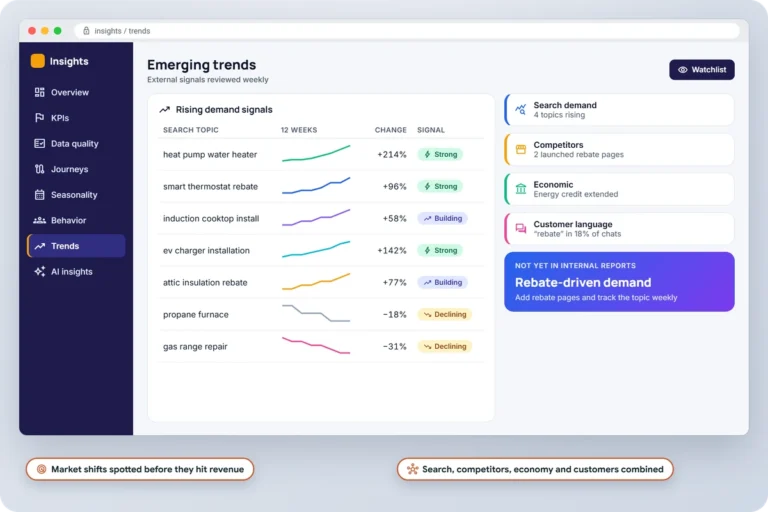
Emerging Trend Analysis Finds Changes Before Internal Reports
Search demand, competitor activity, industry research, economic signals, and customer language can expose a market change before it appears clearly in revenue reporting. The signal still requires verification, but it gives the business something specific to investigate.
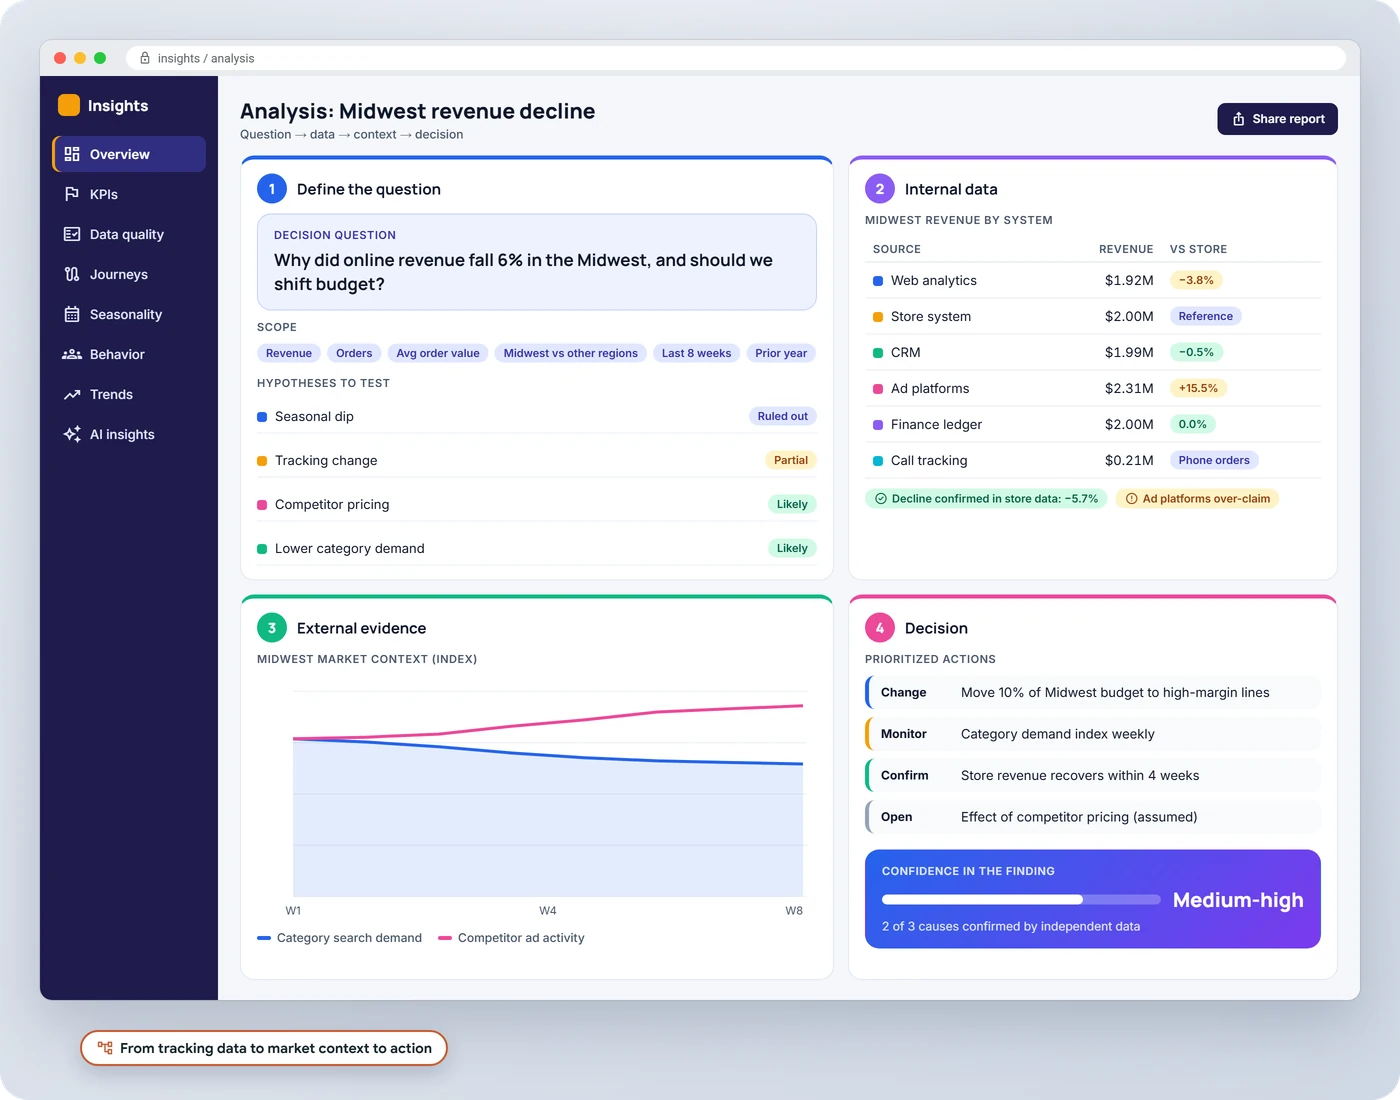
How it works
How Data Analysis Moves From Evidence to Decisions
Step 1 · BUSINESS QUESTION
Business Questions Set the Scope of the Analysis
The work starts with the decision the business needs to make. That question determines the metrics, time periods, segments, comparisons, and external evidence that belong in the review.
Step 2 · INTERNAL EVIDENCE
Internal Data Locates the Performance Change
Website, search, advertising, ecommerce, CRM, sales, and customer records show where the movement occurred. The records are reconciled across dates, definitions, and systems before an explanation is accepted.
Step 3 · EXTERNAL CONTEXT
External Evidence Tests the Likely Explanation
Seasonality, search demand, competitor activity, pricing, promotions, economic events, and consumer behavior can explain changes that tracking software cannot. These signals test whether the initial explanation holds.
Step 4 · BUSINESS DECISION
Decision Analysis Defines What Changes Next
Observed results, interpretations, and unresolved assumptions remain separate. The final analysis states what can change now, what needs monitoring, and what evidence would confirm the decision.
Engagement options
How AI Data Analytics Speeds Up Pattern Detection
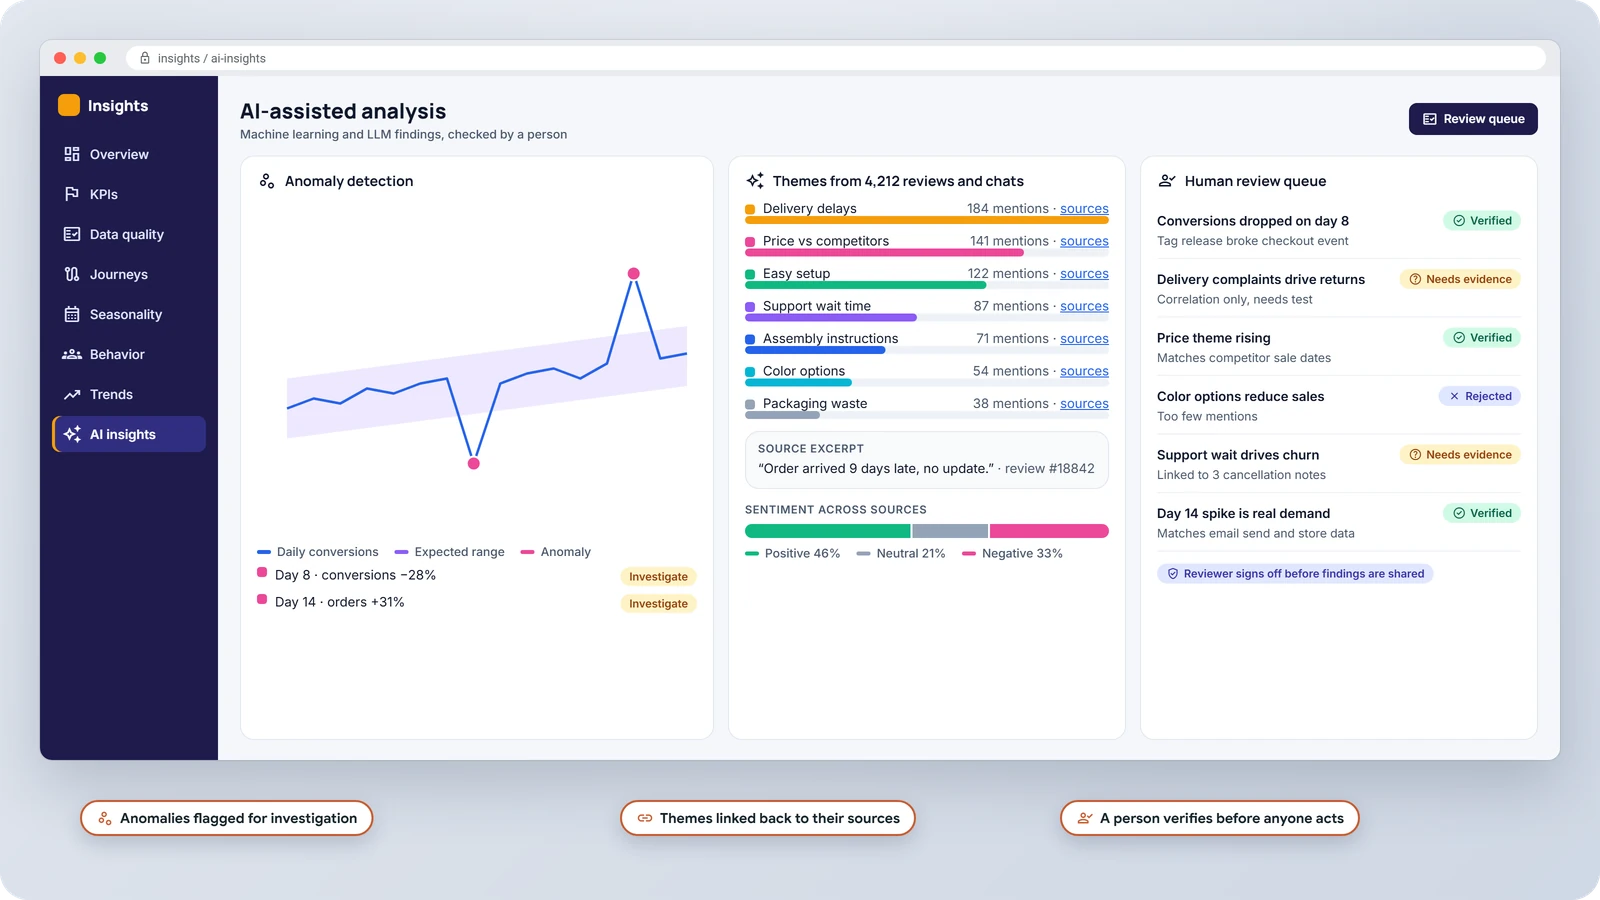
Machine learning and large language models can review large datasets and collections of text faster. But speed is not verification. The inputs, task, and source evidence still need human review.
Machine Learning Flags Anomalies for Investigation
Machine-learning methods can surface unusual movements, outliers, segment changes, and relationships. An anomaly is a signal to investigate, not proof of its cause.
- Compare actual results with expected patterns
- Find changes hidden inside aggregate reporting
- Trace each anomaly to the underlying records
Most common
LLMs Organize Patterns in Unstructured Data
Large language models can group and summarize reviews, surveys, support conversations, sales notes, search queries, and research. Every summary should retain a path back to the source material.
- Group recurring customer questions
- Compare language across audiences and channels
- Check summaries against the original evidence
Human Review Verifies AI Generated Findings
AI output can reflect incomplete data, weak instructions, or unsupported relationships. A reviewer must test important findings, separate correlation from causation, and decide whether the pattern matters to the business.
- Verify findings against source records
- Document assumptions and confidence limits
- Keep final decisions under human control
FAQ
Business Analytics Questions About Performance and Market Change
Which external factors belong in business analytics?
Include any external factor capable of changing demand or customer behavior during the period being reviewed. Common examples are seasonality, holidays, weather, competitor activity, pricing, promotions, economic conditions, regulation, and search demand. The relevant set depends on the business question, market, geography, and timeframe.
How can a business separate seasonality from a real performance change?
Compare the current period with prior years, seasonal baselines, promotional calendars, weather, and category demand. A recurring pattern points to seasonality. A movement outside that pattern requires a closer review of tracking, competition, pricing, inventory, and customer behavior.
How are AI and LLMs used in data analysis?
Machine learning can flag anomalies and relationships across structured datasets. Large language models can organize unstructured material such as reviews, surveys, support conversations, and research. Both can shorten the review process, but important findings still need to be checked against the original data and business context.
Related Capabilities for Search Advertising and Commerce
Google Ads Management
Connect campaign activity with conversion quality, customer acquisition, and verified business outcomes.
SEO Services
Connect organic visibility with technical performance, search demand, and business priorities.
Ecommerce SEO
Measure product discovery, category demand, customer behavior, and revenue across commerce journeys.